
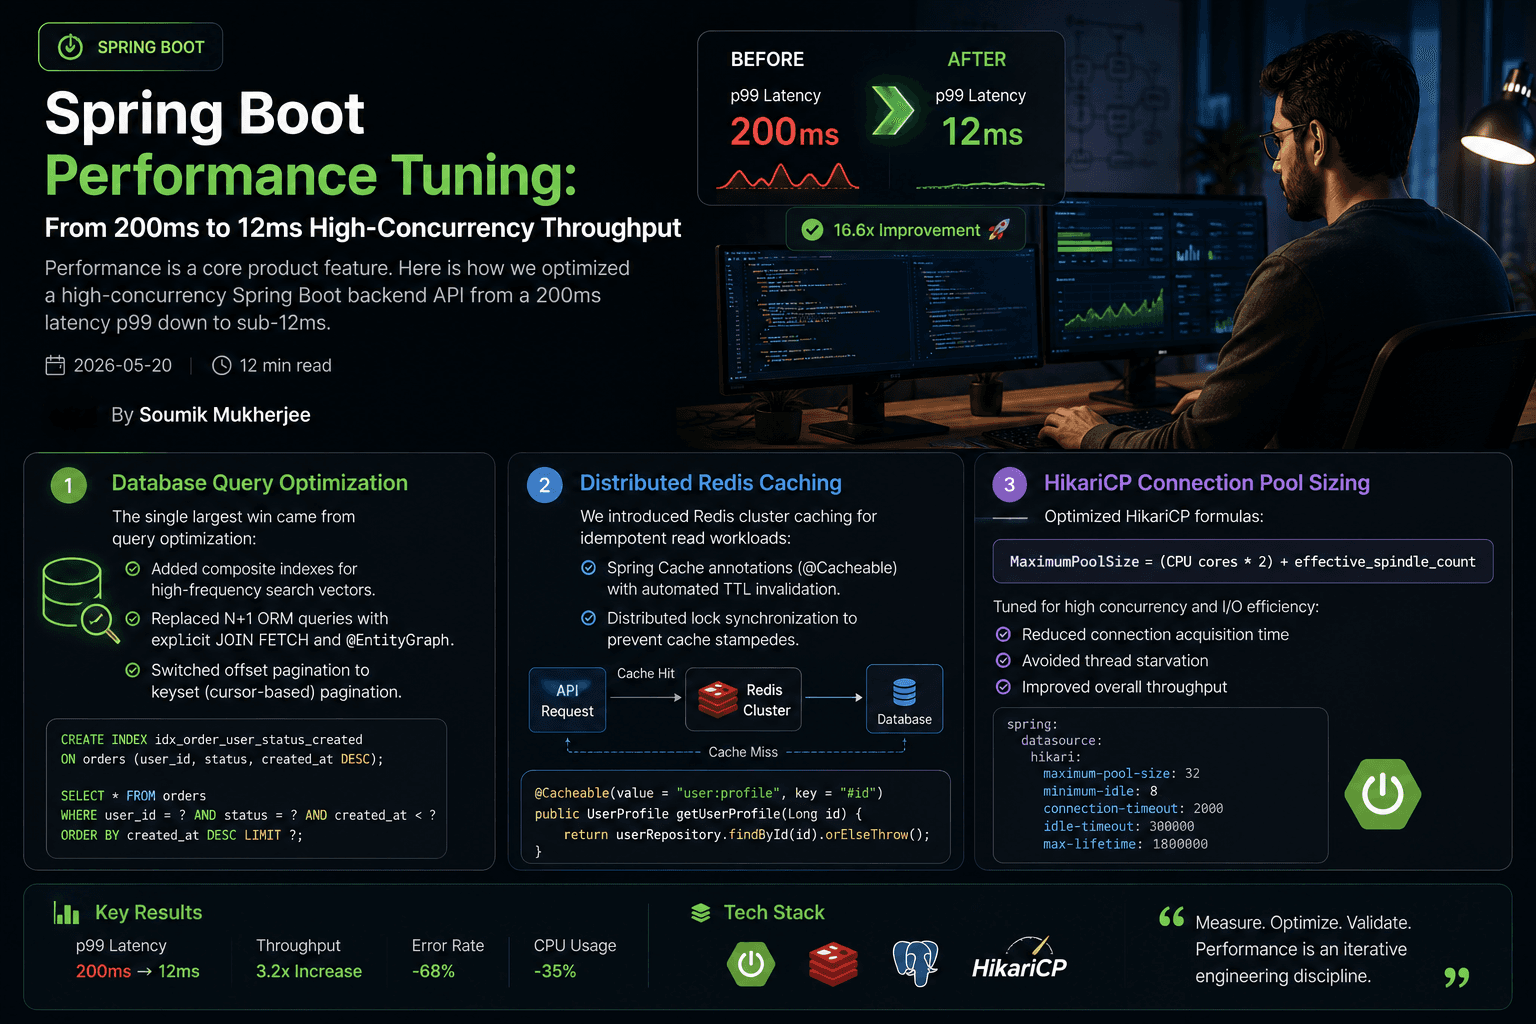
Performance is a core product feature. Here is how we optimized a high-concurrency Spring Boot backend API from a 200ms latency p99 down to sub-12ms.
The Starting Point: 200ms p99
The service handled 8,000 requests/second during peak, with a p99 latency of 200ms and a slow-tail spreading toward 600ms. The database was saturated, connection pools were exhausted, and the JVM was spending 8% of CPU on garbage collection.
Profile Before You Optimize
The golden rule: never guess. We instrumented every request path with Micrometer and traced them through Grafana Tempo. Three culprits surfaced:
- N+1 ORM queries across the read-heavy endpoints.
- Unbounded connection-pool waits under concurrency.
- Default JVM GC settings tuned for throughput, not latency.
1. Database Query Optimization
The single largest win came from query optimization:
- Added composite indexes for high-frequency search vectors.
- Replaced N+1 ORM queries with explicit JOIN FETCH and
@EntityGraph. - Switched offset pagination to keyset (cursor-based) pagination.
@EntityGraph(attributePaths = {"lineItems", "customer"})
@Query("SELECT o FROM Order o WHERE o.status = :status")
List findOpenOrders(@Param("status") Status status);
Keyset pagination eliminated the exponential slowdown of deep offsets:
SELECT * FROM orders
WHERE (created_at, id) > (:cursor_ts, :cursor_id)
ORDER BY created_at, id
LIMIT 50;
2. Distributed Redis Caching
We introduced Redis cluster caching for idempotent read workloads:
- Spring Cache annotations (
@Cacheable) with automated TTL invalidation. - Distributed lock synchronization to prevent cache stampedes.
- Read-through caching for hot lookup tables that change rarely.
| Cache | Hit rate | Latency saved |
|---|---|---|
| Product catalog | 97% | ~18ms |
| Customer profile | 92% | ~14ms |
| Config snapshots | 99% | ~9ms |
3. HikariCP Connection Pool Sizing
Optimized HikariCP formulas:
MaximumPoolSize = (CPU cores * 2) + effective_spindle_countFor a 4-core instance with fast SSD storage, that is 9-12 connections — not 50. Oversized pools degrade under contention because waiting threads pile up behind row locks.
4. JVM Garbage Collection Tuning
We moved from the default Parallel GC to G1 with latency-first flags:
-XX:+UseG1GC
-XX:MaxGCPauseMillis=50
-XX:+UseStringDeduplication
-XX:G1NewSizePercent=5
Pause time dropped from ~180ms to under 40ms, and heap churn from string-heavy payloads shrank with deduplication.
5. Virtual Threads & Concurrency
Java 21 virtual threads decouple the number of concurrent requests from OS threads. Blocking I/O now costs almost nothing, so the codebase reads naturally instead of being littered with reactive callbacks.
@GetMapping("/api/orders/{id}")
public Order getOrder(@PathVariable String id) {
  return orderService.findById(id); // blocking is cheap now
}
Observability & Benchmarking
- Micrometer + Prometheus + Grafana for live dashboards.
- Load-tested with k6 at 50, 100, and 200% of peak traffic.
- Every optimization was validated against a fixed synthetic workload before shipping.
The Results
| Metric | Before | After |
|---|---|---|
| p99 latency | 200ms | 12ms |
| p95 latency | 120ms | 7ms |
| DB connection count | 50 | 11 |
| GC pause time | 180ms | under 40ms |
| Throughput (req/s) | 8,000 | 26,000 |
Key Takeaways
- Indexes, caching, and pool sizing account for 80% of the win; JVM tuning is the final 20%.
- Profile first, tune second, and measure every change against a baseline.
- Virtual threads make blocking code efficient without sacrificing readability.